Access to our EDR:
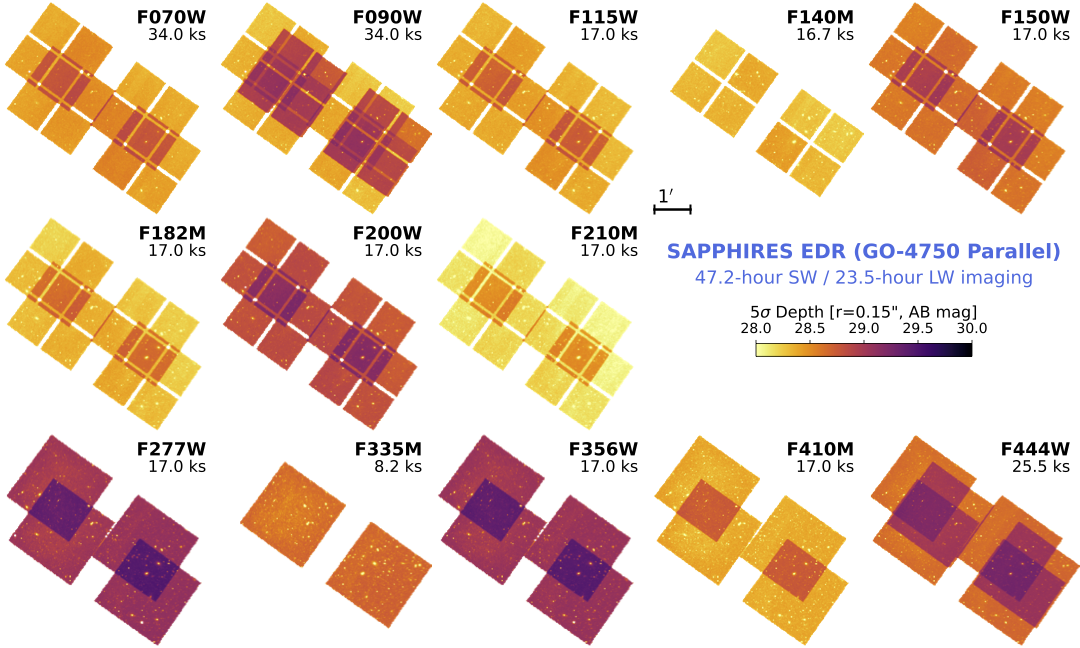
SAPPHIRES EDR focuses on NIRCam imaging and WFSS data obtained in parallel to Frontier Field galaxy cluster MACS J0416.1-2403. The observations were attached to primary observations JWST-GO-4750 (PI: K. Nakajima). With a total dual-channel exposure time of 47.2 hours, we obtain deep NIRCam imaging in 13 bands at 0.6-5.0 micron and deep WFSS at 3.1-5.0 micron through the F356W and F444W filters with grisms in orthogonal dispersion directions.
For detailed descriptions of SAPPHIRES EDR and SAPPHIRES in general, please refer to Sun, F. & Fudamoto, Y. & Lin, X. et al. (2025).
NIRCam Imaging Data
NIRCam imaging observations were obtained with 13 filters, including F070W, F090W, F115W, F140M, F150W, F182M, F200W, F210M (short-wavelength, SW), F277W, F335M, F356W, F410M and F444W (long-wavelength, LW) over a total area of 16.9 arcmin\(^2\). The \(5\sigma\) depths (measured with \(r=0.15^{\prime\prime}\) aperture, point-source) of the images are 28.4~29.5 AB mag across all filters. The NIRCam image mosaics will be shared through SAPPHIRES MAST HLSP website (in preparation).
Dropbox links to the tarballs of 13-band imaging data: SCI extensions (2.9 GB) ERR extensions (2.6 GB) WHT extensions (2.6 GB) I2D FITS (full extensions; 16 GB)
Photometry + Photometric Redshift Catalog
Photometric catalog was constructed using an inverse-varianced-stacked images from F182M to F444W bands. The detection image was iteratively median-filtered to overshred larger galaxies and improve the detectability of blended fainter sources. We then ran a photutils pipeline to detect sources and perform aperture photometry, and an EAZY-py pipeline to compute photometric redshifts.
The combined photometry + photo-z catalog is available as a multi-extension fits file. Photometric catalog column explanation is also available.
Spectroscopic Redshift + Physical Properties Catalog
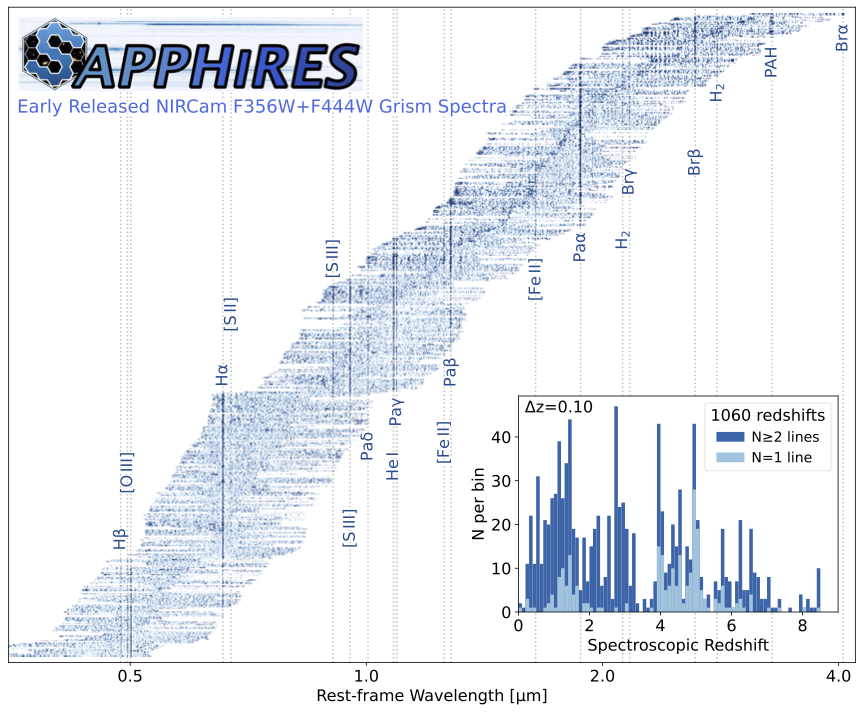
We obtain spectroscopic redshifts from grism line detections using a semi-automatic routine that will be presented by Lin, X. et al. (2025, in prep.). All redshifts solution have been visually inspected, and we include multiple iterations to mask spectral line contaminations and reject / correct wrong redshift identifications. The spectroscopic redshift catalog contains 1060 sources at \(z_\mathrm{spec}=0.0 - 8.5\). We then ran Bagpipes on Kron-aperture photometry for spec-z-confirmed sources to obtain their physical properties, such as stellar masses and star-formation rates.
The combined spec-z + physical properties catalog is available as a multi-extension fits file. Documentation of the catalog is within the fits headers as comments.
NIRCam Grism Spectra of Redshift-Confirmed Sources
We release the 1D, 2D spectra and visualization plots of redshift-confirmed sources. These spectra were extract using the aforementioned photometric catalog through the publicly available (on GitHub) processing routine and calibration documented by Sun, F. et al. (2023, ApJ).
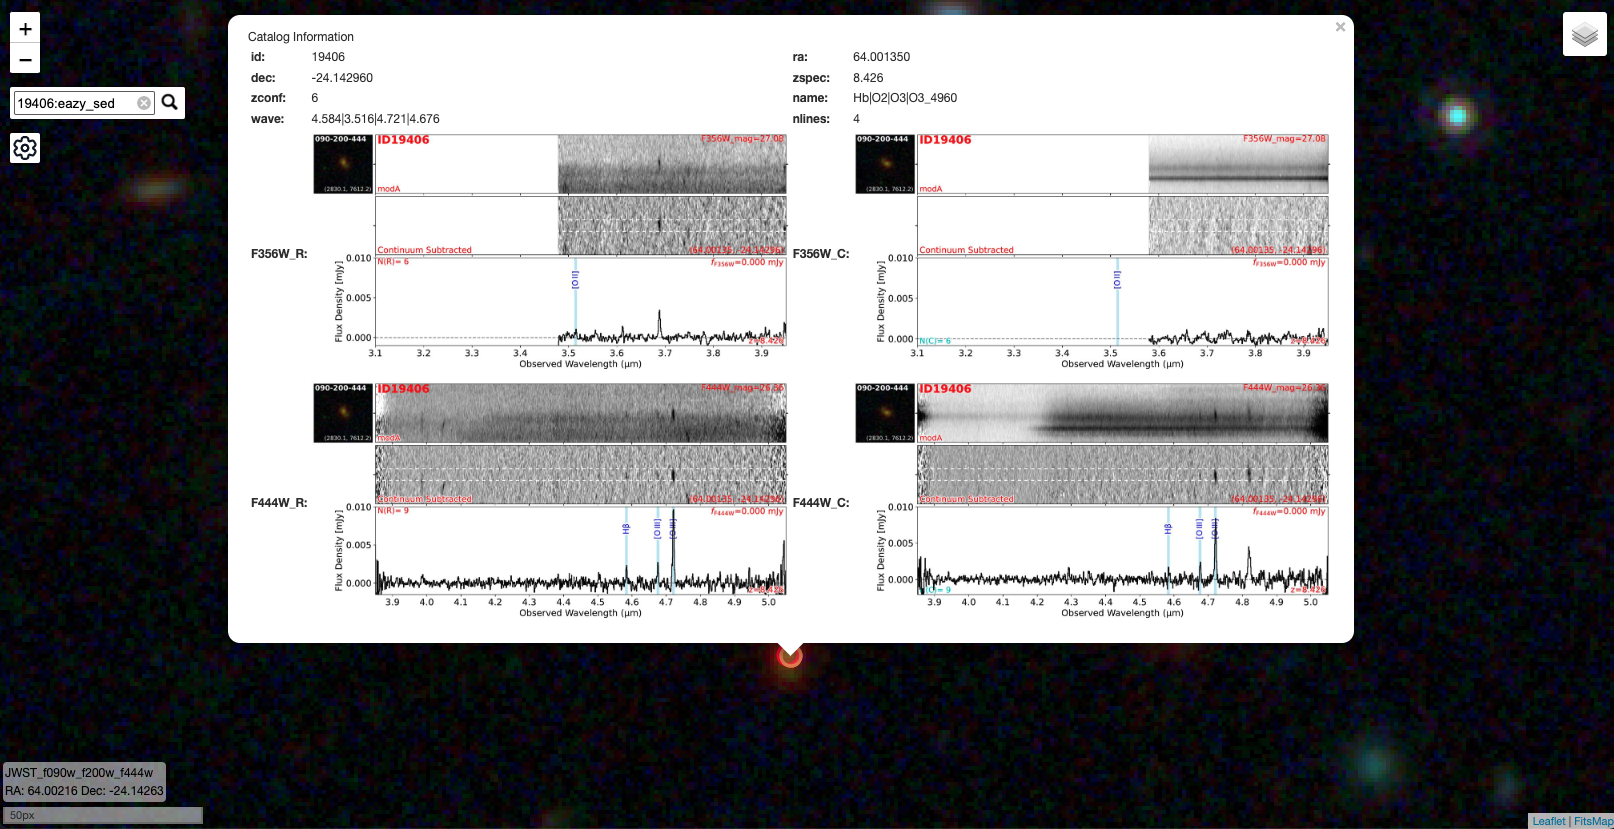
- 2D Spectra is the tarball (~2.0GB) for all 2D spectra taken with F356W / F444W filter and Grism R / C. Spectra taken with different filter × grism combinations were extracted separately. Source information is available in the primary HDU header. Please use
spec2dextension for spectra without continuum subtraction, andline2dextension for spectra with default continuum subtraction. Wavelength definition is in the header ofspec2dextension.statsextension records the information of input grism exposures. - 1D Spectra is the tarball (~150 MB) for all 1D spectra taken with the aforementioned filter × grism combinations, also extracted separately. These spectra were extracted using boxcar aperture (
box) / optimal method (opt) with continuum-unsubtracted (spec1d) / line-only (line1d) 2d spectra. Default units are [micron] and [mJy]. Boxcar spectra (H = 5pix = 0.31") are corrected for aperture loss. - Spectral Plots is the tarball (~1.5GB) for all visual inspection plots of images, 2D spectra (before / after continuum removal) and 1D spectra. In the 1D spectral panel, the black line shows the line-only spectrum with continuum removed, and the grey line shows the continuum-unsubtracted spectrum, which is only plotted when the source is bright enough. These 1D spectra are output in the 1d spectral data products.